

In short ⚡
Supply chain analytics is the discipline of transforming supply chain data across procurement, transport, customs, warehousing, and last‑mile delivery into decision‑grade intelligence that tightens lead times, reduces duty and tax surprises, and improves carrier selection and rate negotiation, using descriptive, diagnostic, predictive, and prescriptive insights to drive concrete operational and cost improvements.In this article, you will find how supply chain analytics works, the key data sources and KPIs, core analytics types including AI-driven models, high‑impact use cases, an ROI-focused implementation roadmap, and specific opportunities when sourcing and shipping from Vietnam.
We hope you’ll find this article genuinely useful, but remember, if you ever feel lost at any step, whether it’s finding a supplier, validating quality, managing international shipping or customs, FNM Vietnam can handle it all for you!
What is supply chain analytics and how does it transform your supply chain?
Supply Chain Analytics is the discipline of turning your supply chain data, from procurement to customs clearance to last-mile delivery, into decisions you can actually execute.
Here’s the thing, it’s not “more dashboards”, it’s decision-grade intelligence that tightens lead time, reduces duty and tax surprises, and improves carrier selection and rate negotiation.
From experience at DocShipper, the moment you connect shipment tracking, warehouse scans, and transport documentation (like your bill of lading and cargo manifest), you stop arguing about what happened and start preventing it.
Quick checklist, are you really doing supply chain analytics yet?
- You can trace delays to a specific lane, carrier, Incoterms choice, or customs brokerage step.
- You can reconcile freight invoice lines with shipping quotes and contracted delivery terms.
- You can see inventory management risk early enough to protect just-in-time delivery.
- You can validate tariff classification and HS code decisions against historical clearance outcomes.
DocShipper Info
DocShipper connects tracking, customs, and freight documents into one execution-ready visibility layer.
Start preventing delays instead of explaining them.
From spreadsheets to connected intelligence across your logistics network
Most teams start “analytics” in a spreadsheet, then discover it breaks the first time you add multimodal transport, intermodal transport, or freight consolidation across suppliers.
Supply Chain Analytics software connects your logistics analytics data streams so you can answer questions fast, like why cross-docking worked on one route but failed on another, or why palletization rules changed cargo handling time at the origin.
We’ve seen a classic scenario, a buyer uses FOB for a time-sensitive containerization flow, then gets hit with a port delay and a documentation mismatch on the bill of lading.
With logistics data analytics in place, you spot the pattern early, certain freight brokers, certain cut-off times, certain export compliance checks, then you fix the workflow instead of firefighting.
Workflow, how you typically move from spreadsheets to a connected system
- Map your execution points: supplier pickup, consolidation, customs clearance, warehousing, last-mile delivery.
- Capture events: milestones, proof of delivery, exceptions, demurrage flags, claims, freight insurance incidents.
- Normalize reference data: carrier codes, lane IDs, SKU dimensions, hazmat attributes, Incoterms, HS codes.
- Automate alerts: lead time drift, routing optimization failures, missed cut-offs, clearance holds.
- Close the loop with actions: carrier selection changes, load planning rules, supplier corrective actions.
Core components: data sources, analytics types, and logistics KPIs that matter
Good supply chain analytics starts with the boring truth, your data sources decide your ceiling.
When your supply chain data includes WMS scans, freight forwarding milestones, customs brokerage statuses, and procurement terms, your logistics analytics becomes operational, not theoretical.
One of our clients thought “late deliveries” came from carriers, until logistics data analytics showed the real culprit, tariff classification rework and missing export compliance fields in transport documentation.
You’ll notice fast that KPIs only matter if you can act on them inside supply chain management, not just admire them on a slide deck.
Data sources you should prioritize first
- Transport execution: shipment tracking events, carrier EDI/API feeds, POD, claims.
- Documentation: bill of lading, commercial invoice, packing list, cargo manifest.
- Customs: import regulations checks, clearance status, HS code history, duty and tax outcomes.
- Warehouse: receiving, put-away, pick/pack, cross-docking timestamps.
- Order and inventory: backorders, safety stock, procurement lead time, supplier OTIF.
KPIs that actually move performance
- End-to-end lead time (and variance), by lane and Incoterms.
- Customs clearance cycle time and hold rate, by product family and HS code.
- Freight cost per shipment and per unit, including accessorials and invoice accuracy.
- OTIF and exception rate, including damage and hazmat non-compliance.
- Warehouse dwell time and cross-dock success rate.
| Component | What it includes | What you gain operationally |
| Data foundation | Master data, lane definitions, carrier IDs, SKU dimensions, Incoterms | Cleaner rate negotiation, better load planning, fewer “apples vs oranges” reports |
| Execution visibility | Shipment tracking, POD, warehouse timestamps, customs statuses | Faster exception handling, fewer missed cut-offs, improved customer promises |
| Analytics layer | Descriptive to prescriptive models, alerts, scenario simulations | Routing optimization decisions you can defend with numbers |
| Action layer | Playbooks, workflows, supplier and carrier scorecards | Real savings, not just reporting, plus continuous improvement |
Key analytics types that power modern logistics and supply chain decisions
Supply Chain Analytics isn’t one “type” of insight, it’s a stack, you start by seeing what happened, then you learn why, then you predict what’s next, and finally you decide what to do.
When you apply that stack to logistics analytics, you stop reacting to missed ETAs and start controlling routing optimization, inventory positioning, and customs clearance risk.
We often see teams get stuck at reporting, and that’s exactly where ROI dies.
To keep your approach grounded, frameworks from APICS help you align analytics to planning and execution, instead of building a disconnected data project.
Checklist, before you choose “fancy AI”, confirm these basics
- You have consistent lane definitions and event milestones across carriers and forwarders.
- You can link orders to shipments to invoices to POD without manual matching.
- You track exception reasons, not just “late” or “on time”.
- You can separate controllable causes (load planning, documentation) from uncontrollable ones (weather).
DocShipper Advice
We help you structure descriptive to prescriptive models aligned with APICS and real transport workflows.
Looking for a Reliable Shipping & Sourcing Partner?
Descriptive, diagnostic, predictive, and prescriptive analytics in operations

In supply chain analytics, descriptive tells you what happened, diagnostic tells you why, predictive forecasts what will happen, and prescriptive recommends what to do next.
In logistics data analytics, that translates into real operational calls, do you switch carrier selection, adjust delivery terms, change freight consolidation rules, or reroute to protect lead time?
A real-world example we run into, a shipper sees a spike in delays and blames the carrier, but diagnostic analytics points to export compliance checks triggered by a new product’s hazmat flag.
Once predictive logistics analytics flags the same pattern on future bookings, prescriptive rules can require pre-validation of documentation before cargo handling even starts.
Workflow, how these analytics types chain together
- Descriptive: late shipments by lane, cost per kg, clearance time by port.
- Diagnostic: delay root causes, HS code change impacts, supplier packing variance.
- Predictive: ETA risk, customs hold probability, inventory stockout risk.
- Prescriptive: recommended routing, carrier switch, safety stock adjustment, cut-off policy change.
| Analytics type | Typical logistics question | Action you can take |
| Descriptive | Where are we losing time and money? | Tighten SLA monitoring, validate freight invoice accuracy |
| Diagnostic | Why did clearance slip or dwell time rise? | Fix documentation, adjust HS code governance, retrain suppliers |
| Predictive | Which shipments will miss ETA? | Proactive rebooking, buffer inventory, expedite selectively |
| Prescriptive | What’s the best plan under constraints? | Routing optimization, load planning, mode shift to protect service |
Cognitive and AI-driven analytics for real-time and predictive logistics analytics
AI in supply Chain Analytics becomes useful when you feed it clean logistics events and let it learn patterns you’d never spot manually, like which supplier packaging behaviors correlate with damage claims or customs inspections.
Done right, cognitive logistics analytics can watch real-time shipment tracking, detect anomalies, and trigger playbooks, before your customer asks “where’s my cargo?”
We’ve handled situations where a container looked “on schedule” until the model flagged a hidden risk, a carrier transshipment hub with a rising miss-connection rate plus tight delivery terms on the PO.
That’s where predictive logistics analytics earns its keep, you can reroute early, adjust freight consolidation, or even change Incoterms on the next order cycle to rebalance risk.
Checklist, what to validate before trusting AI recommendations
- Event latency: are milestones near real-time or updated once per day?
- Explainability: can you see the top drivers of an ETA-risk score?
- Data coverage: do you capture exceptions across all modes and regions?
- Governance: who approves model-driven carrier selection or mode shifts?
- Compliance: are import regulations, export compliance, and documentation rules embedded?
Workflow, a practical AI rollout you can control
- Start narrow: one corridor, one mode, one KPI, like clearance cycle time or ETA risk.
- Train on historical supply chain data: delays, holds, damage, invoice disputes.
- Deploy alerts: anomaly detection on dwell time, cut-offs, missing documents.
- Attach actions: rebooking rules, documentation pre-checks, supplier packaging standards.
- Scale: expand across multimodal transport, warehouses, and customer segments.
If you want this to translate into fewer delays and lower total landed cost, we can help you connect the execution layer, freight forwarding, customs brokerage, warehousing, and shipment tracking, to the analytics layer so you’re not guessing.
That’s typically where DocShipper steps in, aligning your transport documentation, clearance workflows, and data pipelines so supply chain analytics turns into measurable results.
DocShipper Info
We connect freight, customs, and warehouse data so predictive models trigger real-world actions, not just alerts.
High-impact use cases for supply chain and logistics analytics across your network
You do not invest in supply chain analytics for dashboards alone. You invest to solve concrete operational bottlenecks and unlock measurable margin gains.
- Demand forecasting optimization, improve forecast accuracy by SKU and channel, reduce stockouts and excess inventory.
- Inventory optimization, define safety stock dynamically based on variability, lead time, and service level targets.
- Supplier performance management, track OTIF, defect rates, and lead time deviation in real time.
- Transport cost optimization, simulate routing scenarios, consolidate loads, and reduce empty miles.
- Risk monitoring, detect disruption signals from port congestion, weather data, or geopolitical alerts.
- Warehouse performance analytics, optimize picking paths, labor allocation, and slotting strategies.
You can also deploy analytics to support international sourcing decisions. When we manage supplier onboarding and freight coordination, we use data to benchmark cost structures and transit reliability before you commit.
| Use Case | Data Used | Business Impact |
| Inventory optimization | Demand history, lead times, service levels | Lower working capital, fewer stockouts |
| Transport optimization | Freight rates, transit times, lane data | Reduced logistics cost per unit |
| Supplier risk scoring | OTIF, defect rates, geopolitical data | More resilient sourcing strategy |
| Network redesign | Order flows, warehouse capacity, cost-to-serve | Improved service level at lower total cost |
If you import from Asia or manage multi-country flows, these insights directly protect your margin. Even a 5 to 10 percent reduction in logistics cost can transform your competitive positioning.
DocShipper Advice
Our team quantifies logistics savings potential before implementation, so analytics delivers measurable margin gains across your network.
DocShipper Platform
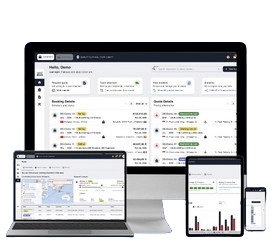
One platform. Your entire supply chain
Sourcing, freight, customs & documents — all centralised, all visible, 24/7.
How to build a supply chain analytics capability that actually delivers ROI
Technology alone will not generate value. You need a structured roadmap aligned with your operational priorities.
- Step 1: Define business objectives, clarify whether you target cost reduction, service improvement, or risk mitigation.
- Step 2: Map your data landscape, identify ERP, WMS, TMS, supplier portals, and external data sources.
- Step 3: Clean and standardize data, harmonize SKUs, units, Incoterms, and lead time definitions.
- Step 4: Select analytics tools, choose software compatible with your IT architecture and scalability needs.
- Step 5: Pilot on a high-impact use case, start with one lane, one warehouse, or one product family.
- Step 6: Integrate into decision workflows, embed insights into S&OP, procurement reviews, and transport planning.
You should treat analytics as a cross-functional program, not an IT side project. Procurement, logistics, finance, and operations must share the same performance indicators.
| Implementation Phase | Main Risk | Mitigation Action |
| Data integration | Inconsistent master data | Create centralized data governance rules |
| User adoption | Resistance to change | Train teams and link KPIs to incentives |
| Scaling | Tool not adapted to complexity | Choose modular and API-ready solutions |
When we support clients in sourcing and freight operations, we connect analytics directly to supplier selection and routing decisions. This ensures that data-driven execution translates into measurable ROI, not just reporting improvements.
DocShipper Alert
We embed data-driven execution into sourcing, routing, and carrier selection to secure real ROI.
Supply chain analytics in Vietnam: market specifics and data opportunities
Vietnam offers strong manufacturing growth and export capacity, but data fragmentation remains a challenge. You must structure your analytics approach around local realities.
- Port congestion monitoring, especially in Ho Chi Minh City and Hai Phong.
- Supplier maturity variability, SMEs may lack standardized reporting systems.
- Cross-border customs analytics, track clearance times and compliance patterns.
- Freight rate volatility, monitor seasonal peaks and container availability.
You can leverage customs data, carrier APIs, and on-site inspection reports to enrich your analytics models. In emerging markets, visibility gaps often represent the biggest optimization opportunity.
| Vietnam-Specific Factor | Analytics Opportunity | Operational Benefit |
| Growing export volumes | Capacity forecasting models | Secure space with carriers earlier |
| Supplier heterogeneity | Performance benchmarking | Select reliable partners faster |
| Infrastructure variability | Transit time variability analysis | More accurate delivery commitments |
When you source from Vietnam, you need granular visibility across production, inland trucking, and international freight. We integrate supplier audits and freight tracking data to build a connected visibility layer across your network.
Conclusion
You now understand how supply chain analytics transforms operations into a measurable competitive advantage. The next step is disciplined execution.
- You use analytics to optimize forecasting, inventory, transport, and supplier performance.
- You align data initiatives with clear financial and service-level objectives.
- You integrate tools into daily operational workflows, not just management reports.
- You adapt your models to local market realities, especially in high-growth regions like Vietnam.
- You turn logistics data into strategy that protects margin and improves resilience.
If you want to connect analytics with sourcing, supplier validation, and international freight execution, we help you design and operate a data-driven supply chain from end to end.
FAQ | Supply chain analytics: how data turns your logistics network into a competitive edge
Spreadsheets feel “good enough” as long as you have a few lanes, a handful of suppliers, and low shipment volume. The moment you manage multimodal flows, frequent customs interactions, or several 3PLs, spreadsheets hide root causes instead of revealing them. A good rule of thumb: if you can no longer explain lead time drift, cost variance, or customs delays without a week of manual reconciliation, it’s time to move to a connected analytics layer that pulls data directly from your WMS, TMS, forwarders, and customs brokers.
The most common mistake is starting with a giant “analytics platform” project instead of a focused business problem. Teams integrate every data source, build complex dashboards, and only then ask what decisions should change. A more effective approach is to pick one painful use case—like customs clearance holds on a specific corridor—then define what data, KPIs, and workflows you need to fix that. Once that delivers value, you extend the same model to other lanes and functions.
In daily operations, analytics quietly drives routing, consolidation, and carrier selection choices. Planners use lane-level lead time and reliability data to decide whether to split shipments or consolidate, and invoice history to negotiate accessorials with carriers. In customs and documentation, clearance-time analytics helps decide which products need pre-checks or buffer stock. The value doesn’t come from a dashboard review; it comes from embedding those insights into transport planning, S&OP meetings, and supplier reviews.
Analytics frequently uncovers “silent leaks” that don’t appear clearly in standard P&L views. For example, you may discover that one carrier’s low base rate is offset by systematic accessorial charges, or that a specific port consistently drives demurrage and detention. It can also show how repeated documentation errors inflate rework and storage costs. By linking freight invoices, shipment events, and customs outcomes, you see total landed cost per lane and per SKU, not just average freight spend.
You don’t need a full data engineering department to begin. Start by standardizing basic identifiers—SKUs, lanes, carriers—and exporting clean CSVs from your WMS, TMS, or forwarder portals into a simple BI tool. Then focus on one or two questions, such as “Which lane has the highest delay rate?” or “Which supplier causes the most urgent air shipments?” Over time, you can ask your logistics partners or a specialized provider to expose APIs and automate these feeds once you know exactly what you want to monitor.
Before you let analytics drive automatic routing, carrier selection, or safety stock changes, you should consistently hit three conditions: your master data (SKUs, lanes, Incoterms) is stable, your event capture (tracking, warehouse scans, customs statuses) is timely and complete, and your teams already use the insights manually with good results. Once those are in place, you can safely introduce controlled automation—such as rule-based rebooking when ETA risk exceeds a threshold—while monitoring exceptions closely for a few cycles.
The only cure is to limit analytics to decisions with owners, SLAs, and financial impact. For each dashboard or report, define who is responsible, what threshold triggers action, and what that action is. If a metric has no owner and no consequence, it’s noise. By keeping a short list of “operational KPIs that must drive a reaction”, you protect teams from dashboard fatigue and ensure your supply chain analytics remains a decision engine, not a reporting museum.
Read more
Looking for more? Check out these articles.
Need Help with Logistics
or Sourcing in Vietnam ?
First, we secure the right products from the right suppliers at the right price by managing the sourcing process from start to finish. Then, we simplify your shipping experience - from pickup to final delivery - ensuring any product, anywhere, is delivered at highly competitive prices.
Fill the Form
Prefer email? Send us your inquiry, and we’ll get back to you as soon as possible.
Contact us